Named for Tax Code §42.26 · Equal & Uniform
Ranked over-assessment leads. The equity exhibit your case is built on.
We run the §41.43(b)(3) equal-and-uniform test on every improved commercial parcel in the certified roll with five or more comparables (7,741 of 17,418), rank the results by cap-aware estimated savings, and deliver TDLR-registered consultants a prospect list with a one-page evidence sheet per parcel — prepared in your firm's name.
Request a free sample See the measured results
Data and software onlyWe never represent ownersCalibrated on published ARB outcomes
same type, same market area, size and age bands
the §41.43(b)(3) number
taxable path · future-year benefit
every figure cited to source and vintage
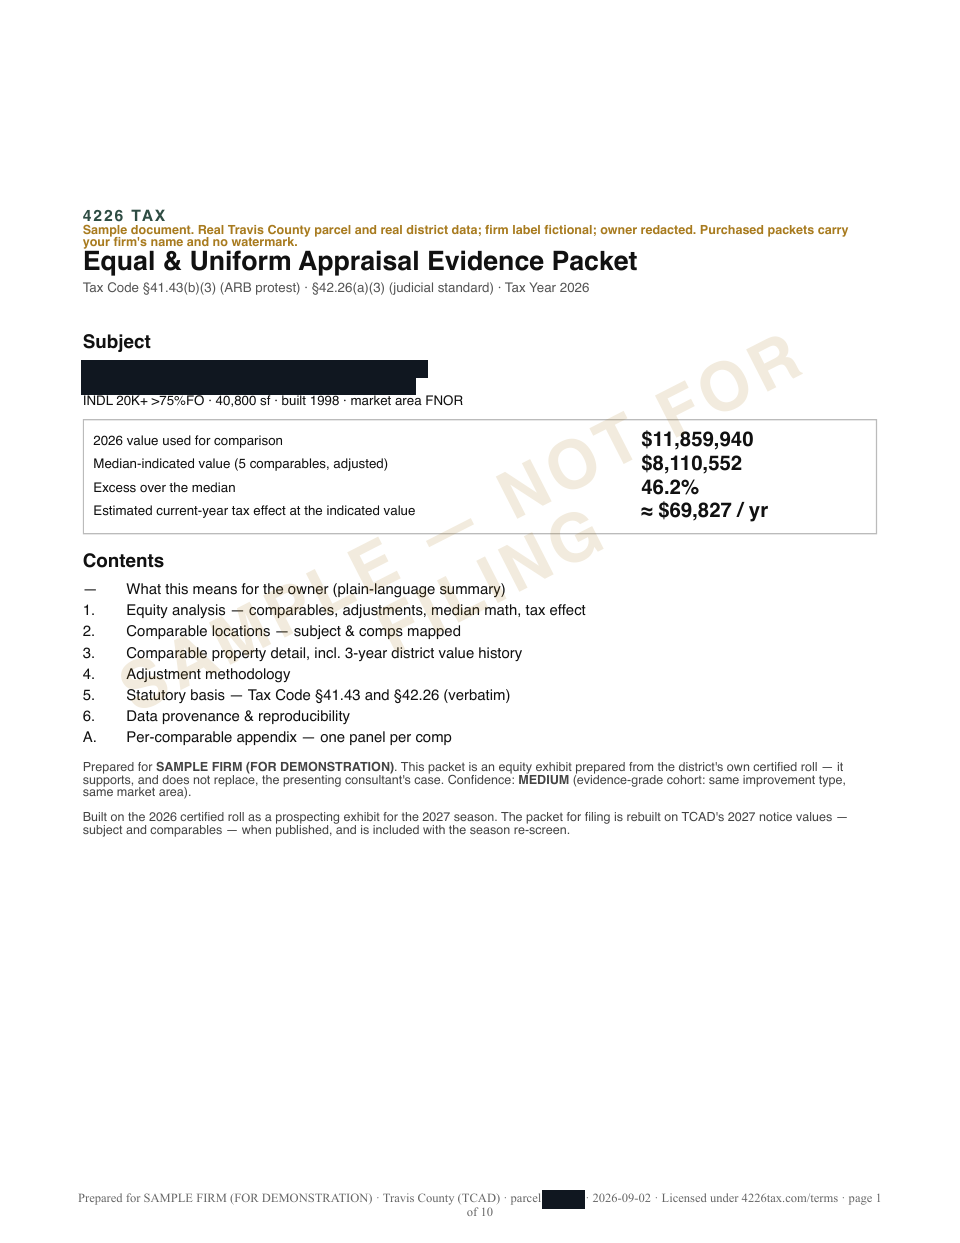
| Travis County (TCAD) parcel 73•••• · WADLEY PL C, 78728 | Owner: owner withheld in this sample |
| Class F1 · INDL 20K+ >75%FO (type 66) · market area FNOR | Building 40,800 sf · built 1998 · class C · 1 bldg(s) |
| Market value $11,859,940 (land $1,039,728 + improvements $10,820,212) | Land 173,288 sf · land share 9% · appraised $11,859,940 · taxable $11,859,940 |
| Improvement value / sf: $265.20 | |
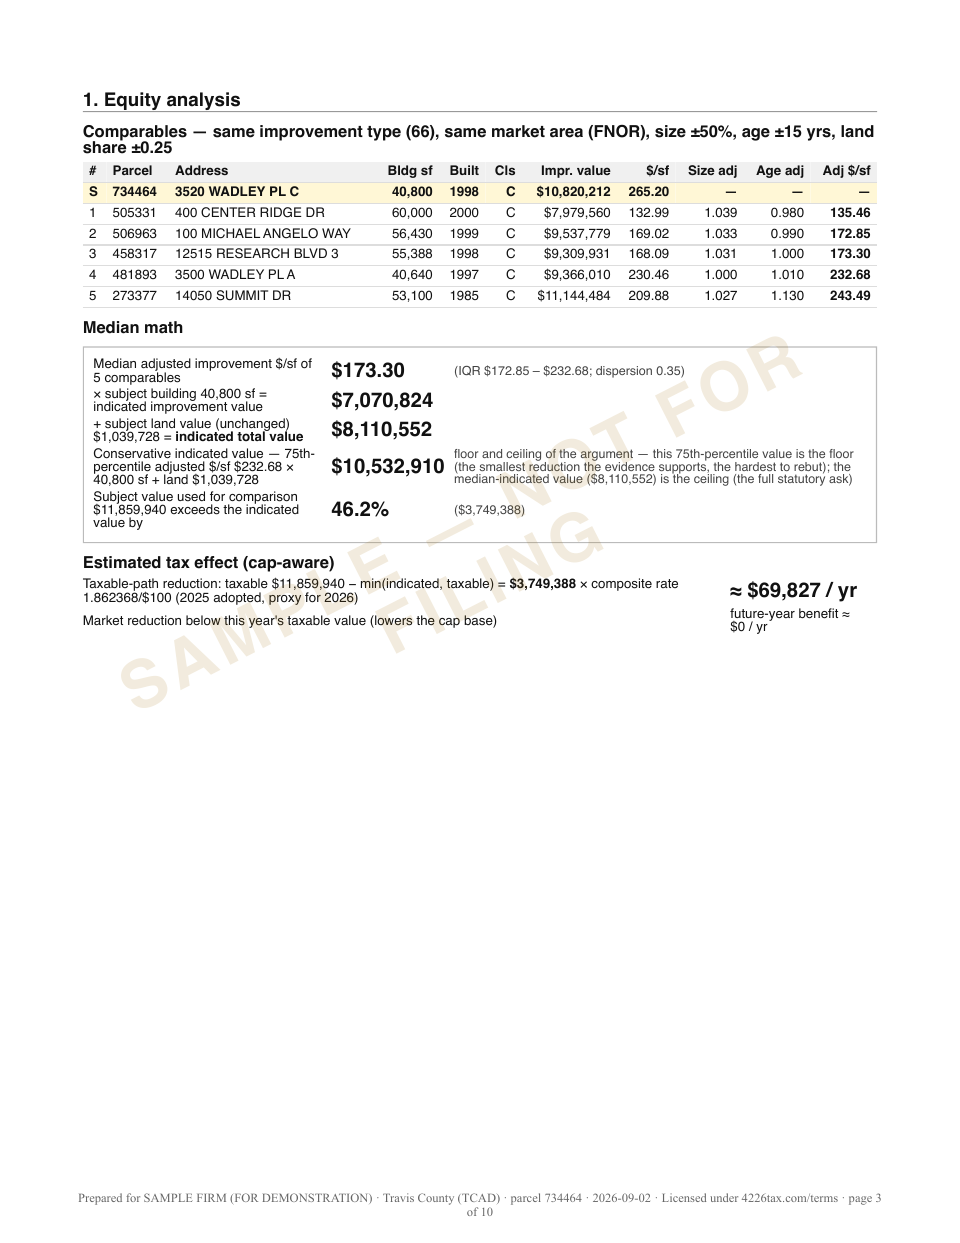
| # | Parcel | Address | Bldg sf | Built | Cls | Impr. value | $/sf | Size adj | Age adj | Adj $/sf |
|---|---|---|---|---|---|---|---|---|---|---|
| S | 73•••• | WADLEY PL C | 40,800 | 1998 | C | $10,820,212 | 265.20 | — | — | — |
| 1 | 50•••• | CENTER RIDGE DR | 60,000 | 2000 | C | $7,979,560 | 132.99 | 1.039 | 0.980 | 135.46 |
| 2 | 50•••• | MICHAEL ANGELO WAY | 56,430 | 1999 | C | $9,537,779 | 169.02 | 1.033 | 0.990 | 172.85 |
| 3 | 45•••• | RESEARCH BLVD 3 | 55,388 | 1998 | C | $9,309,931 | 168.09 | 1.031 | 1.000 | 173.30 |
| 4 | 48•••• | WADLEY PL A | 40,640 | 1997 | C | $9,366,010 | 230.46 | 1.000 | 1.010 | 232.68 |
| 5 | 27•••• | SUMMIT DR | 53,100 | 1985 | C | $11,144,484 | 209.88 | 1.027 | 1.130 | 243.49 |
| Median adjusted improvement $/sf of 5 comparables | $173.30 |
| interquartile range $172.85 – $232.68 · dispersion 0.35 | |
| × subject building 40,800 sf = indicated improvement value | $7,070,824 |
| + subject land value (unchanged) $1,039,728 = indicated total value | $8,110,552 |
| Subject value used for comparison $11,859,940 exceeds the median-indicated value by | 46.2% ($3,749,388) |
| Reduction on the taxable path: taxable $11,859,940 − min(indicated, taxable) = $3,749,388 × composite rate 1.862368 per $100 (2025 adopted rates, proxy for 2026) | ≈ $69,827 / yr |
| Market reduction not reaching this year's taxable value (lowers the cap base) | future-year benefit ≈ $0 / yr |
Screen: for each subject, comparables are drawn from the same county roll with the same improvement-type code and market area, building size within ±50%, year built within ±15 years and land share within ±0.25; parcels worth mostly land (land share > 60%) are excluded. The subject's value is compared with the median of the comparables' adjusted improvement value per square foot, as §41.43(b)(3) and §42.26(a)(3) require.
Sources: Travis Central Appraisal District, Appraisal Export - 2026 (certified export, supplement 0001, run 08/05/2026 10:49, TP export v8.0.0.33), traviscad.org/publicinformation; tables PROP, IMP_INFO, IMP_DET, LAND_DET, STATE_CD. Tax rates: Travis County Tax Office truth-in-taxation table qryJurisRateWeb2026.xls (traviscountytx.gov/tax-rates), 2025 adopted total rates summed over the parcel's TCAD entity codes. Statute: Tax Code §41.43, §42.26 (tcss.legis.texas.gov, retrieved 2026-08-22).
1,479flagged commercial parcels, Travis County TY2026
Identical screen, run on prior-year noticed values and joined to HCAD's published hearing outcomes. 2025 replicates: 92.6% vs 88.4% reduced. Full tables below.
366 + 82never-represented + recently-lapsed — open prospects
92% vs 86%formal-hearing reduction rate, flagged vs unflagged (2024; 2025: 93% vs 88%)
Formal ARB hearings — high-confidence cohortsHarris · TY2024
2 seasonsof published ARB outcomes behind every claim
Travis County · TY2026 · TCAD export supp. 1 · 2026-08-05
What's in the list
Every figure is computed from the county's own certified export and rate tables — nothing scraped, nothing estimated by hand.
- Ranking
Cap-aware savings, parcel by parcel
F1–F5 commercial parcels ranked by estimated annual savings at each parcel's actual composite rate, with §23.231 circuit-breaker math applied so capped parcels show the taxable path and the future-year benefit separately.
- Confidence
Tiers you can rely on
HIGH / MEDIUM / LOW from cohort size and dispersion. Only evidence-grade cohorts — same improvement type, same market area — receive evidence sheets. Low-confidence flags showed no measured lift, so they're labeled and excluded.
- Evidence
The exhibit that slots into your case
Comp grid with documented size and age adjustments, the median math, indicated value, estimated savings, and full source citations — one page, "Prepared for your firm." Built on the 2026 certified roll as a prospecting exhibit, rebuilt on the 2027 notice values for filing (included), in the form TCAD's informal channel consumes — documented evidence uploaded 48 hours ahead; for formal hearings, the same lead expands to a full packet (comp detail, methodology, verbatim statute, provenance). You own the case — this is the equity exhibit inside it.
- Hygiene
The junk is already removed
Parcels in active litigation, public and institutional owners, and assets over $25M (quarantined with a written memo each) never reach your list. Ambiguous lapse signals are triaged: likely-still-represented parcels are removed entirely, soft lapses are labelled pending confirmation, and only verified lapses make the headline counts.
- Severe tier
The biggest gaps, labeled — not buried
A minority of flagged parcels are assessed so far above their equity-indicated value — or carry a value per square foot so far outside their cohort — that they warrant a closer look, not automatic exclusion. In our Harris County backtest these parcels, when protested, produced the largest realized reductions of any group we measured — a small sample (134 outlier-stratum and 548 extreme-excess parcels across two years), so ranges are historical, not predictive. Each is labeled and carries a field-verification note: confirm the subject is a true peer of its comparables before filing.
How we know it works · Harris County, 2024–2025
Measured, not promised
Harris County publishes the outcome of every appraisal protest hearing. So we ran our screen — unchanged — on two prior years of Harris values and checked what happened to the properties it flagged as over-assessed versus the ones it didn't.
Flagged properties won reductions more often, and the reductions were larger. The pattern held in both years.
Why it matters. Your fee scales with the cut. A screen that finds larger reductions on the same hearing is worth more per protest.
92% vs 86%share of properties that won a reduction at a formal hearing, flagged vs. unflagged (2024; 2025: 92.6% vs 88.4%)
11.9% vs 8.7%average cut in appraised value, flagged vs. unflagged (2024; 2025: 10.1% vs 8.4%)
| Year | Flagged: won a reduction | Unflagged: won a reduction | Flagged: average cut | Unflagged: average cut |
|---|---|---|---|---|
| 2024 | 92.0% | 86.4% | 11.9% | 8.7% |
| 2025 | 92.6% | 88.4% | 10.1% | 8.4% |
Measured among properties that protested. Historical results, not a guarantee for any parcel.
What arrives · our own outputs, nothing staged
The packet, the map, the list
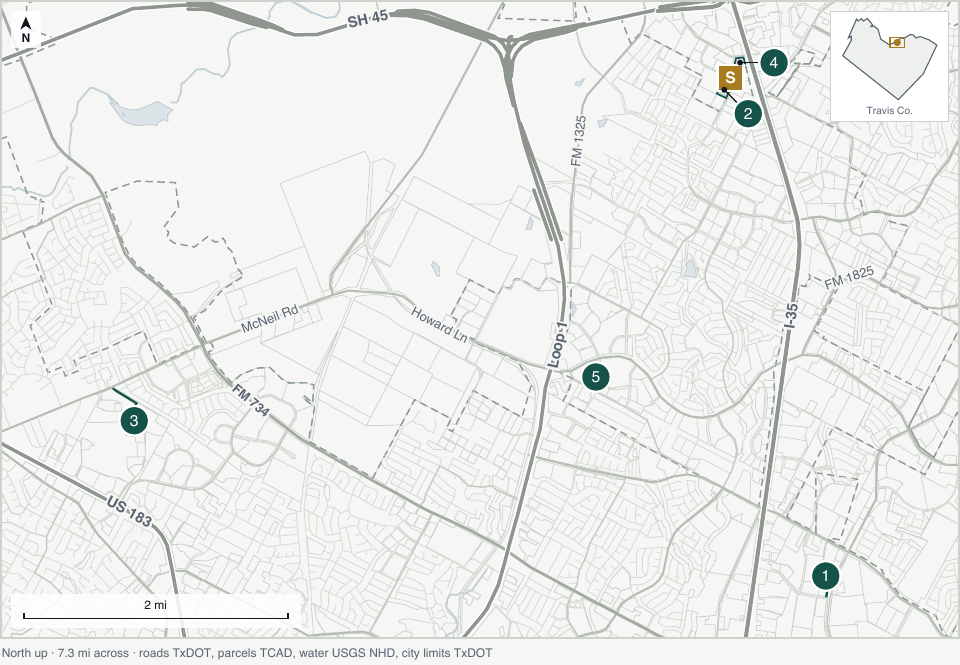
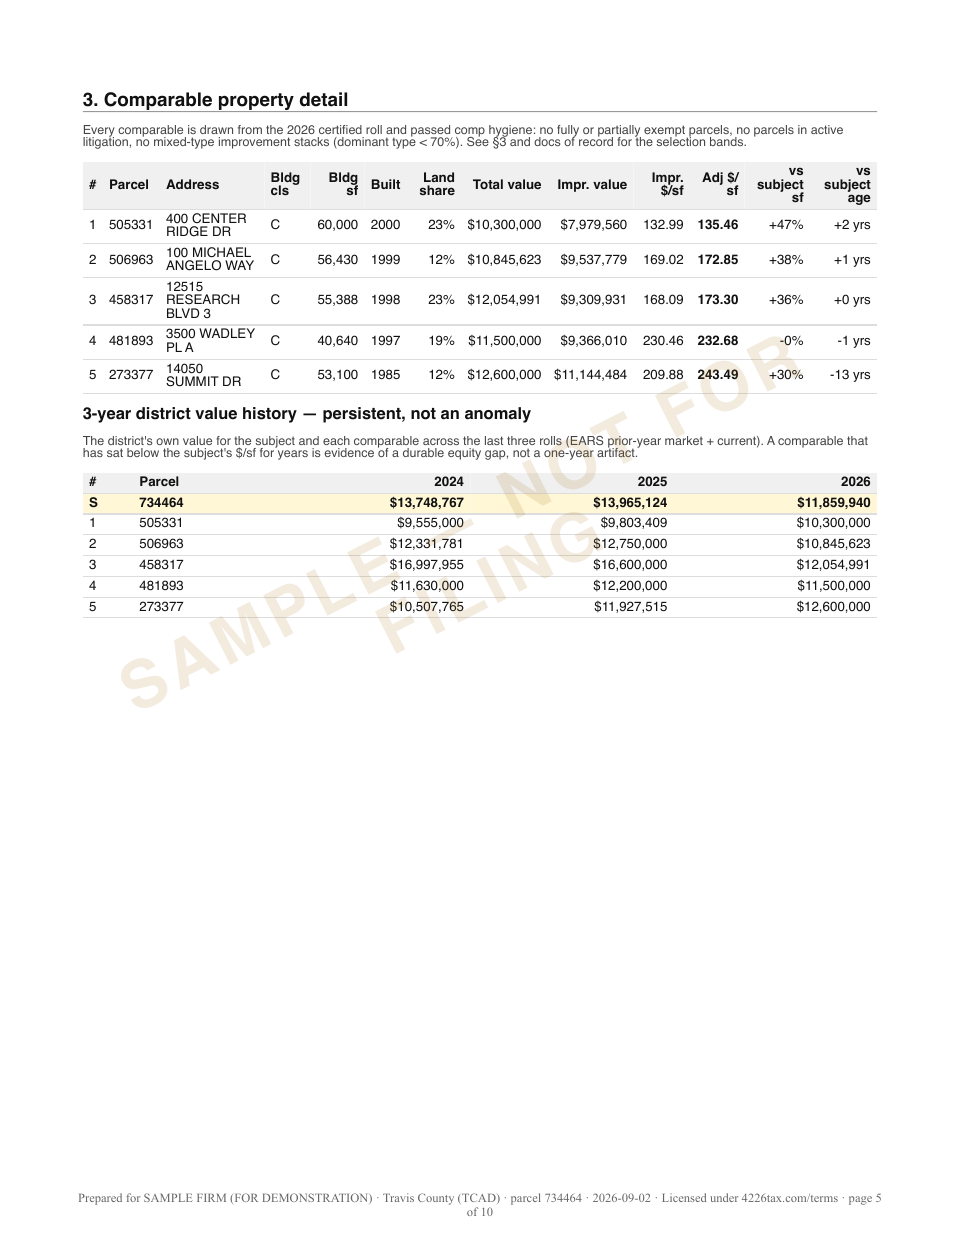
| rank | parcel_id | owner_name | mail_address | mail_city | mail_state | mail_zip | mail_deliverable | portfolio_id | owner_parcel_count | est_savings |
|---|---|---|---|---|---|---|---|---|---|---|
| 39 | 93•••• | •••••• LLC | •••• WOODSTONE PLAZA | HATTIESBURG | MS | 39402-8342 | Y | 18•••• | 1 | $207,951 |
| 122 | 52•••• | •••••• COMMERCE | •••• E 5TH ST | AUSTIN | TX | 78701-3725 | Y | 15•••• | 1 | $86,286 |
| 124 | 10•••• | •••••• LLC | •••• % ALTURA POINT GROUP LLC, 343 S HIGHWAY 101 STE 200 | SOLANA BEACH | CA | 92075-1879 | Y | 20•••• | 1 | $84,730 |
| 150 | 73•••• | •••••• FOR | •••• STACEY S DOBOS ETAL, 1325 HOWARD AVE PMB 609 | BURLINGAME | CA | 94010-4212 | Y | 19•••• | 1 | $69,827 |
| 159 | 88•••• | •••••• INC | •••• HELIOS WAY | PFLUGERVILLE | TX | 78660-6010 | Y | 17•••• | 1 | $65,941 |
Our verification standard · ✻ checked against the county, not ourselves
Every number traces back to the county
A lead list is only worth what its data is worth. Three standards hold before anything reaches you — each one measured against a source we don't control.
Reconciled to the county's certified totals
Our Travis roll ties to TCAD's own published Certified Totals within a fraction of a percent, and every point of the difference is traced to a documented category convention — not error.
Every deliverable parcel verified against county records
Every parcel in every list, sheet, and packet is built from — and reconciled field-by-field to — TCAD's own certified appraisal export: value, class, exemptions, agent. Each season a stratified sample is independently re-checked against the live county portal; the latest pass matched appraised value on 200 of 200 parcels.
Claims calibrated on two seasons of published outcomes
Every performance number we quote is measured — the identical screen run on two prior years of Harris County notices, joined to HCAD's published ARB hearing results. Nothing here is a projection.
Behind these three: an independent from-scratch recomputation of the math, deterministic hash-identical rebuilds, and mutation testing of the scoring code — detail on the methodology page. Verification re-runs for every county and season before delivery; the full report is available to customers on request.
Packages · Travis County · 2026 season
Two products, priced like the tools they replace
A season of prospecting ammunition, or evidence production for the book you already have. Delivered within two business days of purchase.
Season Package $3,000 one county, one season
- The complete ranked county list — 1,479 flagged commercial parcels; 448 open prospects (366 never-represented and 82 recently lapsed, each named with its prior firm and authorization end date)
- An owner-portfolio view groups parcels under common ownership — one signature can carry several protests — with a top-owners sheet leading the delivery
- Evidence sheets for the 100 highest-ranked open prospects (never-represented and recently lapsed), prepared in your firm's name, each expandable to a formal-hearing packet; sheets for parcels another firm already represents come through Evidence Packets
- The severe tier — the parcels whose excess historically produced the deepest realized cuts — labeled with its measured context
- April 2027 notice-season re-screen included (subject to county publication) — the list re-ranks and the exhibits are rebuilt on the 2027 notice values for filing
- Parcels in litigation, public and institutional owners, and assets over $25M are already removed
Evidence Packets $1,500 per 50 sheets — first 5 free
- A one-page equity exhibit per parcel — subject summary, adjusted comparable grid, median math, cap-aware savings, sources and statutes — in the form TCAD's informal channel consumes (documented evidence uploaded 48 hours ahead) — built on the 2026 certified roll as a prospecting exhibit, rebuilt on the 2027 notice values for filing (included)
- Expandable to a six-page formal packet: owner-facing summary for the client conversation, comparable location map, per-comparable detail, methodology, verbatim statute, provenance
- First five free on parcels you represent; then $1,500 per 50 at any scale your season needs
Founding Five — 5 firms only Founding Season $1,500 + $1,500 only when the list signs your third client
- Everything in the Season Package
- Founding bonus, 2027 season: full evidence-sheet coverage of every evidence-grade open prospect at no charge
- Milestone billing — the second half is due only on results
No savings guarantee. No refunds after delivery. Milestone terms on the receipt.
Every deliverable ✻ re-verified against live county records at delivery · every figure cited to source and vintage · licensed under 4226tax.com/terms.
Free sample · Personalized to your book
See your county before you spend a dollar
A watermarked top-10 for Travis, personalized to your firm
Email your firm name and TDLR license number and you'll receive the ten highest-ranked leads with full evidence detail, watermarked, in your firm's name. Three free half-list pilot seats are reserved for firms willing to share season outcomes — ask.
or write to [email protected]
The 20% circuit breaker on non-homestead parcels valued at $5.32M or less expires December 31, 2026, with no extension enacted as of August 2026. 2026 is the last cycle in which lowering a capped parcel's market value is a "future-year benefit" rather than next year's full exposure. Our savings figures report both paths separately.